


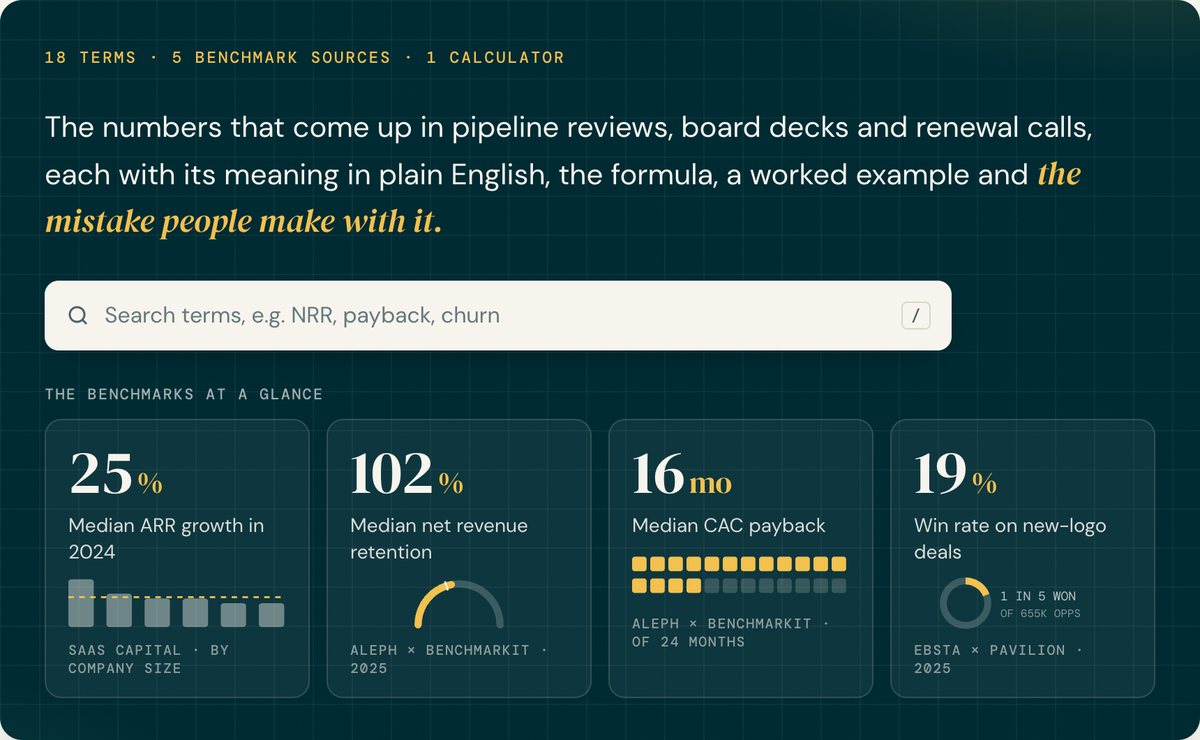

The numbers that come up in pipeline reviews, board decks and renewal calls, each with its meaning in plain English, the formula, a worked example and the mistake people make with it.
Survey A figure from a published 2025–26 benchmark study, linked at the bottom. Rule of thumb A common investor heuristic, not a survey figure.
No terms match ““. Try ARR, churn or payback.
Revenue base
The numbers everything else is measured against.
ARR
Annual recurring revenuealso MRRThe yearly value of every active subscription, as if nothing changed from today. MRR is the same figure per month.
- Formula
- fx
= MRR × 12 - Example
- 40 customers each paying $50,000 a year = $2M ARR.
- Watch out
- ARR is a snapshot, not money in the bank. One-off fees for services, set-up or training never count, and a three-year deal adds one year’s value, not three.
ACV
Annual contract valueWhat one contract is worth per year. It describes a deal, or the average deal, rather than the whole customer base.
- Formula
- fx
= total contract value ÷ contract years - Example
- A $300,000 deal over three years = $100,000 ACV.
- Watch out
- Teams disagree on whether one-off fees go in. Check which definition a report uses before you compare two ACV figures.
TCV
Total contract valueEverything the customer commits to pay over the full term, one-off fees included.
- Formula
- fx
= (ACV × contract years) + one-off fees - Example
- Three years at $100,000 plus $30,000 onboarding = $330,000 TCV.
- Watch out
- TCV makes deals sound big in announcements, but it says nothing about yearly run rate. Never add it to ARR.
Industry benchmarks
ARR growth by company size
Year-on-year ARR growth in 2024 for more than 1,000 private B2B SaaS companies, from SaaS Capital’s 2025 survey.
25th to 75th percentileMedian25%, the median for all companies
What it tells you
- Median growth across the whole survey was 25%, down from 30% the year before.
- What counts as fast depends on size. Top-quartile growth starts at 50% for a $1M–$3M company and at 31% above $20M.
- A newer sample of 2025 data from Aleph × Benchmarkit puts median growth at 20%.
- Contract size alone didn’t predict growth. Only companies with an ACV above $250K grew faster than average.
Retention
What happens to revenue from customers you already have. The calculator after NRR shows how the six terms fit together.
Logo churn
also customer churnThe share of customers who left during the period, counted by head rather than by dollars.
- Formula
- fx
= customers lost ÷ customers at start - Example
- 200 customers at the start of the year, 10 leave = 5% logo churn.
- Watch out
- Ten small customers leaving and one large one leaving can give the same logo churn and very different revenue losses. Pair it with revenue churn every time.
Revenue churn
also gross revenue churnThe share of starting ARR lost to customers who left or now pay less.
- Formula
- fx
= (churned ARR + contraction) ÷ starting ARR - Example
- $10M at the start, $600K from customers who left, $200K from downgrades = 8% revenue churn.
- Watch out
- Revenue churn and GRR describe the same thing from opposite ends. 8% revenue churn means 92% GRR.
Contraction
also downgradeRevenue lost from customers who stay but pay less: fewer seats, a lower tier or a discount at renewal.
- Example
- A $100,000 customer renews at $80,000 = $20,000 contraction.
- Watch out
- It’s easy to miss because the customer still shows as retained. A renewal at a 20% discount is contraction, even if the deal team calls it a save.
Expansion
also upsell, cross-sellExtra revenue from customers you already have: a bigger plan, another product, more seats or usage, or a price rise.
- Example
- A $100,000 customer adds a second product for $25,000 = $25,000 expansion.
- Watch out
- Price rises usually count as expansion. NRR built on price rises says less about the product than NRR built on customers using more of it.
GRR
Gross revenue retentionalso GDR, gross dollar retentionOf last year’s revenue from existing customers, how much you still have, ignoring any upsell. It tells you whether customers stay.
- Formula
- fx
= (starting ARR − churn − contraction) ÷ starting ARR - Example
- $10M start, $600K churn, $200K contraction. $9.2M ÷ $10M = 92% GRR.
- Good looks like
- SurveyMedians run 84–91%, depending on the survey. Rule of thumb90%+ is healthy, and strong enterprise businesses hold 95%+.
92%84%91%
Survey mediansHealthy, 90%This example
- Watch out
- GRR can’t go above 100%. If someone quotes GRR at 105%, they mean NRR.
NRR
Net revenue retentionalso NDR, net dollar retentionGRR plus the expansion from those same customers. Above 100% means revenue from existing customers grows even if you sign no one new.
- Formula
- fx
= (starting ARR − churn − contraction + expansion) ÷ starting ARR - Example
- The same $10M, plus $1.5M expansion. $10.7M ÷ $10M = 107% NRR.
- Good looks like
- SurveyMedians run 101–103%, and Aleph × Benchmarkit puts the top quartile at 110%. Rule of thumb120%+ is best in class.
107%92%102%110%
Middle half of companiesMedianBest in class, 120%This example
- Watch out
- Customers signed during the year don’t count, so NRR only covers the group you started with. A high NRR can sit on top of a weak GRR, which means expansion is covering for churn. Ask for both numbers.
Retention calculator
Change any figure. The ledger, both percentages and their place against the benchmarks update as you type.
Churn and contraction cost 8.0 points. Expansion adds back 15.0, so revenue from existing customers grows 7.0% over the year.
Industry benchmarks
GRR and NRR
Medians from four 2025–26 studies. Each samples different companies, so read each row on its own terms.
| Source | Sample | Median GRR | Median NRR | Spread |
|---|---|---|---|---|
| Aleph × Benchmarkit | 342 B2B SaaS and AI companies, 2025 data | 84% | 102% | NRR quartiles: 92% to 110% |
| Benchmarkit | Private B2B SaaS, 2025 data | 88% | 101% | Top performers: NRR 130%+ |
| SaaS Capital | Bootstrapped, $3M–$20M ARR | 91% | 103% | 90th percentile: GRR 100%, NRR 117.9% |
| KeyBanc / Sapphire | Private SaaS, 2025 survey | 86% in 2023, heading back toward 90% | Above 100% | Not published |
Median growth by NRR band
2024 growth, SaaS Capital 2025 survey. Excludes companies under $1M ARR.
Median NRR by size and pricing
2025 data, Aleph × Benchmarkit. Dashed line marks 100%: red dots lose revenue from existing customers, green dots grow it.
What it tells you
- Retention drives growth. Companies with NRR above 130% grew 44% at the median, almost three times the 15% for companies below 100%.
- GRR sets a floor. In SaaS Capital’s data, companies with GRR below 85% grew slower than the median.
- Small companies are the most likely to shrink their existing base, with median NRR under 100% below $5M ARR.
- Usage-based pricing adds about 10 points of NRR over seat-based, because customers pay more as they use more.
Aleph’s page gives 110% as its headline top-quartile NRR and 108% in one later passage. This page uses the headline figure.
Unit economics
Whether winning a customer pays for itself, and how fast.
CAC
Customer acquisition costWhat you spend on sales and marketing to win one new customer.
- Formula
- fx
= sales and marketing spend ÷ new customers won - Example
- $1.5M spent in a quarter, 15 new customers = $100,000 CAC.
- Watch out
- Leaving out salaries, commissions or tooling makes CAC look smaller. Fully loaded CAC includes all of it, and it’s the only version worth comparing.
CAC payback
also payback periodHow many months of gross profit from a new customer it takes to earn back what you spent to win them.
- Formula
- fx
= CAC ÷ (monthly revenue per customer × gross margin) - Example
- $100,000 CAC. The customer pays $8,000 a month at 75% gross margin, which is $6,000 a month of profit. Payback is about 17 months.
- Good looks like
- SurveyMedian 16 months, strongest quartile 6 months or less. Rule of thumbUnder 12 months is strong.
17 mo61624 mo
Middle half of companiesMedianStrong, under 12This exampleLower is better
- Watch out
- Use gross profit, not revenue. At a 75% margin, payback calculated on revenue comes out 25% shorter and flatters the number.
LTV
Lifetime valuealso CLVThe gross profit you expect from one customer over the whole time they stay.
- Formula
- fx
= (ARR per customer × gross margin) ÷ annual revenue churn - Example
- $96,000 a year at 75% margin is $72,000 of profit a year. At 12% annual churn, $72,000 ÷ 0.12 = $600,000 LTV.
- Watch out
- The churn input swings the answer hard. At 6% churn the same customer is worth $1.2M. Treat LTV as a direction, and show the churn figure next to it.
LTV:CAC
Lifetime value to acquisition costLifetime gross profit for every dollar spent winning a customer.
- Formula
- fx
= LTV ÷ CAC - Example
- $600,000 LTV ÷ $100,000 CAC = 6:1.
- Good looks like
- SurveyMedian 4.1:1, strongest quartile 7.8:1. Rule of thumb3:1 is the usual floor.
6:11.14.17.8
Middle half of companiesMedianUsual floor, 3:1This example
- Watch out
- It inherits every assumption inside LTV. If the churn rate behind LTV is optimistic, so is the ratio.
Magic number
also sales efficiencyHow much new ARR each dollar of last quarter’s sales and marketing spend produced.
- Formula
- fx
= net new ARR this quarter ÷ S&M spend last quarter - Example
- $1.2M net new ARR this quarter, $1.5M sales and marketing spend last quarter = 0.8.
- Good looks like
- Rule of thumbAbove 0.75, spending more on sales and marketing should pay off. Below 0.5, fix efficiency first.
0.80.50.75
Fix efficiencyWatchRoom to spendThis example
- Watch out
- It uses last quarter’s spend because deals lag spend. With long enterprise cycles one quarter is noisy, so look at a trailing four quarters. Some teams use the quarter’s revenue change × 4 in place of net new ARR, so check which version you’re reading.
Rule of 40
Revenue growth rate plus profit margin should add up to 40 or more. It puts a fast-growing, loss-making company and a slower, profitable one on the same scale.
- Formula
- fx
= revenue growth % + profit margin % - Example
- 25% growth and an 18% free cash flow margin = 43, a pass.
- Good looks like
- SurveyMedian 25, strongest quartile 43, so most companies don’t pass.
4372543
Middle half of companiesMedianPass mark, 40This example
- Watch out
- Say which margin you used. EBITDA margin and free cash flow margin can differ a lot, and the score moves with them.
Industry benchmarks
What drives payback
2025 data from the Aleph × Benchmarkit study of 342 B2B SaaS and AI companies. Quartiles for CAC payback, LTV:CAC and Rule of 40 are on each entry above.
Median CAC payback, in months
Bars run from 0 to 24 months. Aleph’s page doesn’t report the 31–50% growth band or the contract sizes between $5K and $50K.
What it tells you
- Efficiency improved in 2025. Median payback fell from 18 months to 16, and the median Rule of 40 score rose from 15 to 25.
- The fastest growers pay back fastest, in 10 months. Companies growing 21–30% take more than twice as long.
- The median company spends $1.63 on sales and marketing for each $1 of new-customer ARR.
- LTV:CAC sat at 3.6 to 3.7 from 2022 to 2024 before rising to 4.1 in 2025.
Pipeline and sales
Whether this quarter’s number is reachable.
Pipeline coverage
Open qualified pipeline compared with the target still to close.
- Formula
- fx
= open qualified pipeline ÷ remaining target - Example
- $9M of qualified pipeline against a $3M target = 3x coverage.
- Good looks like
- Rule of thumb3x is the usual target. The coverage you need is roughly 1 ÷ your win rate.
- Watch out
- 3x only works with a win rate around 33%. At a 20% win rate you need about 5x.
Win rate
also close rateOf the deals that reached a decision, the share you won.
- Formula
- fx
= deals won ÷ (deals won + deals lost) - Example
- 12 won, 28 lost = 30% win rate.
- Good looks like
- Survey19% for new-logo deals across 655,000 opportunities.
30%19%50%
Median new-logo win rateThis example
- Watch out
- Definitions vary. Some count every opportunity created, some only qualified ones, and some leave out deals that ended in no decision. The same team can show very different rates, so agree the definition before you compare.
Sales cycle
also time to closeHow long a deal takes from opportunity created to closed-won.
- Formula
- fx
= median days from created to closed-won - Example
- Half your won deals closed within 94 days = 94-day median cycle.
- Good looks like
- SurveyExpansion deals closed in 52 days on average. No single new-business figure holds across segments.
- Watch out
- A few slow deals drag the average up. Use the median, and measure every deal from the same starting stage.
Industry benchmarks
Win rates and deal effort
From the Ebsta × Pavilion 2025 GTM Benchmarks: 655,000 opportunities worth $48B across 349 companies.
What it tells you
- Four in five new-logo deals are lost, so size pipeline from your own win rate. At 19%, that’s about 5x coverage, not 3x.
- None of the studies we checked gives a pipeline coverage benchmark. 3x is a sales convention, so treat it as a starting point.
Ebsta’s page shows these figures as images. The numbers here are as quoted, with page references to the report PDF, in Konabayev’s summary of the report.
Commonly confused
Pairs that get swapped in decks and forecasts.
GRRvsNRR
GRR leaves expansion out and caps at 100%. NRR adds expansion and can go higher.
Revenue churnvsGRR
The same fact from opposite ends. They always add up to 100%.
Logo churnvsrevenue churn
Logo churn counts customers. Revenue churn counts dollars.
ARRvsACV
ARR is the whole base per year. ACV is one contract per year.
ACVvsTCV
ACV is per year. TCV is the full term plus one-off fees.
CAC paybackvsLTV:CAC
Payback is how fast you earn back the cost of a customer. LTV:CAC is how much you earn back in total.
Benchmarks come from SaaS Capital’s 2025 growth benchmarks and bootstrapped benchmarks, the Aleph × Benchmarkit 2025 data on NRR, CAC payback, LTV:CAC and Rule of 40, Benchmarkit’s 2025 data, the 2025 KeyBanc / Sapphire SaaS survey and the Ebsta × Pavilion 2025 GTM Benchmarks.
The Aleph figures were read from Aleph’s summary pages, not the full report. Rule-of-thumb ranges are common investor heuristics. Compiled 3 November 2026.